Plumber Hourly Rate: BLS Pay Data and How to Set Your Rate (2026)
Last updated November 1, 2026. This guide is based on Bureau of Labor Statistics wage pages, checked on November 1, 2026, plus a rate-setting method we wrote ourselves. ScopeRivo may earn a commission from some links; read our affiliate disclosure.
As a wage, the plumber hourly rate has an official benchmark. BLS reports a 2025 median of $63,800 per year, or $30.67 per hour, for plumbers, pipefitters and steamfitters. That is what workers earn, not what a plumbing company charges customers. To set your own billed rate, work up from labor cost, overhead and profit using the method below.
Plumber hourly rate at a glance (BLS data)
All pay figures in this guide come from the Bureau of Labor Statistics Occupational Outlook Handbook, which uses May 2025 data from the Occupational Employment and Wage Statistics survey. BLS groups plumbers with pipefitters and steamfitters, so the plumber hourly rate below covers all three. The table shows what the official BLS plumbers page publishes, as of November 1, 2026.
| Measure (BLS, May 2025 data) | Plumbers, pipefitters and steamfitters |
|---|---|
| Median hourly pay | $30.67 |
| Median annual pay | $63,800 |
| Lowest 10 percent earned less than (annual) | $44,150 |
| Highest 10 percent earned more than (annual) | $108,420 |
| Median annual pay, all occupations | $50,980 |
Figures as of November 1, 2026, from the BLS Occupational Outlook Handbook. BLS states the range as annual pay, so we have not converted it to hourly figures. For comparison, BLS notes that in May 2025, the median annual wage for all workers was $50,980.
What the median does and does not tell you
BLS defines the median as the wage at which half the workers in an occupation earned more than that amount and half earned less. It is a midpoint, not an average, and not a starting wage. On the plumbers page, BLS adds that the lowest 10 percent earned less than $44,150, and the highest 10 percent earned more than $108,420. A first-year apprentice and a master plumber running a commercial crew sit at very different points in that spread.
BLS also says earnings vary by experience, responsibility, performance, tenure, and geographic area. Two practical points follow. A national plumber hourly rate is a starting reference, not a local benchmark. And the OOH pay tab excludes self-employed workers, so owner-operators are not in these numbers at all.
Pay by type of employer
BLS breaks out where plumbers, pipefitters and steamfitters work and what they earn in their top industries:
- Government, excluding state and local education and hospitals, at $71,660 and plumbing, heating, and air-conditioning contractors at $63,010.
- BLS lists plumbing, heating, and air-conditioning contractors at 65% of employment and self-employed workers at 8%.
In other words, most plumbers work for contractors, and the contractor median sits close to the overall median. If you run a plumbing company, that contractor figure is the closest official reference for the wage side of a plumber hourly rate, before local adjustments.
Apprentices, licensing and hours
Pay rises with training. BLS says most plumbers learn through a 4- or 5-year apprenticeship, and apprentices typically receive 2,000 hours of paid on-the-job training each year, plus technical instruction. It also notes that apprentices earn less than fully trained workers, and that their pay increases as they learn to do more.
Licensing matters too. Most states and some localities require plumbers to be licensed, often after 2 to 5 years of experience and an exam. Hours are not nine to five: BLS says plumbers are often on call for emergencies, so evening and weekend work is common. Those on-call hours affect both what you pay technicians and how you price after-hours work. Our guide on how to start a plumbing business covers licensing steps in more detail.
Plumber pay per hour vs. HVAC, electricians and maintenance workers
Plumbing competes for workers with the other building trades, so it helps to see plumber pay per hour beside its neighbors. The table uses each occupation’s BLS Occupational Outlook Handbook page, as of November 1, 2026. Ranges are annual, as BLS publishes them.
| Occupation (BLS, May 2025 data) | Median hourly | Median annual | Lowest 10% below | Highest 10% above |
|---|---|---|---|---|
| Plumbers, pipefitters and steamfitters | $30.67 | $63,800 | $44,150 | $108,420 |
| Electricians | $30.38 | $63,190 | $42,640 | $108,510 |
| HVAC mechanics and installers | $29.33 | $61,010 | $40,050 | $95,210 |
| General maintenance and repair workers | $23.84 | $49,590 | $35,350 | $77,180 |
Figures as of November 1, 2026. The individual sources are below, so you can check each number yourself.
- Electricians: BLS reports median pay of $63,190 per year, or $30.38 per hour (BLS electricians page).
- For electricians, the lowest 10 percent earned less than $42,640, and the highest 10 percent earned more than $108,510.
- HVAC technicians: median pay of $61,010 per year, or $29.33 per hour (BLS HVAC page).
- For HVAC workers, the lowest 10 percent earned less than $40,050, and the highest 10 percent earned more than $95,210.
- General maintenance and repair workers: median pay of $49,590 per year, or $23.84 per hour (BLS maintenance and repair page).
- For maintenance and repair workers, the lowest 10 percent earned less than $35,350, and the highest 10 percent earned more than $77,180.
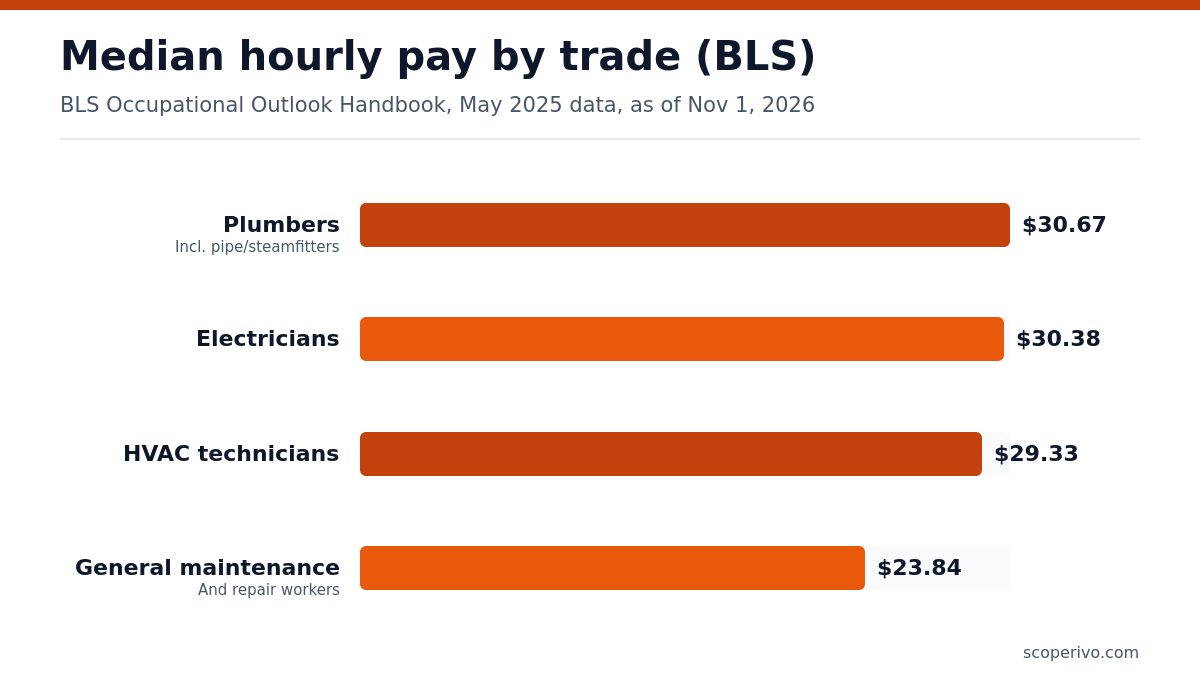
The pattern is clear. Plumbers and electricians sit almost level, HVAC technicians a little lower, and general maintenance workers well below all three. If you run a mixed shop with plumbing and HVAC, or you hire handymen for light plumbing tasks, these gaps shape who you can recruit and what the labor line in your plumber hourly rate has to carry. For HVAC-specific operations, see our HVAC software guide.
Median vs. mean: reading the wider wage release
The Occupational Outlook Handbook reports medians. The BLS May 2025 Occupational Employment and Wages news release mostly reports means (averages), which can sit above the median when a few workers earn a lot. Mixing the two leads to misleading comparisons.
- The annual mean wage across all construction and extraction occupations was $65,360, less than the U.S. average wage of $69,770.
- Among the lowest paying construction occupations, the release lists helpers of pipelayers, plumbers, pipefitters, and steamfitters ($43,730) as a yearly figure.
Neither figure is the plumber median, so do not compare them directly with the median above. The helper figure is useful if you are budgeting for a plumber’s helper rather than a licensed technician.
Job outlook for plumbers
BLS expects demand to keep growing. It projects employment of plumbers, pipefitters, and steamfitters to grow 7 percent from 2025 to 2035, much faster than the average for all occupations, with about 42,000 openings projected each year. For an owner, that points to continued competition for skilled technicians, which tends to push the labor portion of your plumber hourly rate up over time.
Three questions hiding behind “plumber hourly rate”
People type the same phrase for different reasons, and each needs a different kind of answer. Knowing which one you are asking saves you from comparing numbers that do not belong together.
“What will I earn as a plumber?”
For job seekers and technicians, the plumber hourly rate is a wage. The BLS figures above are the right reference, adjusted for your state and metro area, your license level and whether you work in service, new construction or for a government employer.
“What will a plumber charge me?”
For homeowners, the plumber hourly rate is a price, and no official source publishes it. Get written quotes and ask the same questions of each company: is there a trip or diagnostic fee, a minimum charge, a different after-hours rate, and how are materials billed? Comparing like with like matters more than the headline number.
“What should my company bill?”
For owners, the plumber hourly rate is a business calculation built on your costs, which the rest of this guide walks through step by step.
Why a wage is not the price a customer pays
Most people searching for a plumber hourly rate want to know what a plumber charges. No official source publishes billed plumbing rates, and we will not guess one. What we can explain is why the billed rate is always well above the wage: the business has to recover far more than the hourly paycheck.
- Payroll costs on top of wages: employer payroll taxes, workers’ compensation, benefits and paid time off.
- Unbillable time: drive time, supply runs, estimates, callbacks, training and slow days.
- Vehicles and tools: trucks, fuel, maintenance, drain machines, cameras and press tools.
- Overhead: insurance, licenses, office staff, dispatch, software, rent, phones and marketing.
- Warranty and risk: return visits on your own work and jobs that run long.
- Profit: money to reinvest, survive slow months and pay the owner.
The right plumbing labor rate for one shop can be wrong for another with the same wage bill, because overhead and billable hours differ. That is why the method below uses your numbers, not an industry multiplier.
How to calculate your billable plumber hourly rate
This method turns your own costs into a billable hourly rate. Every value is a placeholder. Pull the inputs from your payroll reports, profit and loss statement and job history; your bookkeeper or accountant can help confirm them. Our guide to QuickBooks for contractors shows where most of these numbers live.
Step 1: Work out loaded labor cost per paid hour
Start with the technician’s hourly wage, then add everything you pay because that person is on payroll: employer payroll taxes, workers’ comp, health or retirement contributions, paid holidays and training. Divide the annual total of those extras by paid hours and add it to the wage. Use your actual payroll figures; rates vary by state and insurer.
Step 2: Find your billable ratio
Not every paid hour is billable. Track a few weeks of time sheets and compare hours billed to customers with hours paid. Illustration only: if a technician is paid for 40 hours in a week and bills 30 of them, the billable ratio is 30 divided by 40, or 0.75. Use your own numbers; they vary widely by service area, drive distances and job mix.
Step 3: Convert to labor cost per billable hour
Divide the loaded cost per paid hour by the billable ratio. Continuing the illustration, a ratio of 0.75 means each billed hour has to carry the cost of about 1.33 paid hours, because 1 divided by 0.75 is about 1.33. This step alone explains much of the gap between a plumber hourly rate as a wage and what a customer sees on the invoice.
Step 4: Spread overhead across billable hours
Total a year of overhead from your profit and loss statement: vehicles, fuel, insurance, office wages, software, rent, phones, marketing, licenses and small tools. Divide it by the billable hours your whole team produced in that year. If you are new, build the overhead budget from quotes and plan billable hours conservatively.
Step 5: Add profit with a margin, not a guess
Add Step 3 and Step 4 to get your break-even rate. Then choose a target net margin, written as a decimal, and divide the break-even rate by one minus that margin. Dividing this way protects the margin you chose; simply adding the same share on top would leave you with a smaller margin than planned. The margin is your business decision; no official source sets it.
Step 6: Test the result against the market
Compare your billable hourly rate with how often customers accept your quotes, how often jobs run over, and what local wage data says about labor costs. If the rate is higher than your market will bear, the fix is usually in Step 2 (more billable hours through better scheduling and routing) or Step 4 (lower overhead), not in cutting profit.
Copy the worksheet below into a spreadsheet. Each letter feeds the next line.
BILLABLE HOURLY RATE WORKSHEET (one technician or one crew)

A. Loaded labor cost per PAID hour
   Hourly wage:                                   [wage]
   Payroll taxes per hour:                        [amount]
   Workers' comp and liability share per hour:    [amount]
   Benefits, paid time off, training per hour:    [amount]
   A = total of the four lines above:             [A]

B. Billable ratio
   Paid hours per year:                           [paid hours]
   Billable hours per year (on the clock at
   customer sites, after drive, shop, callbacks):  [billable hours]
   B = billable hours / paid hours:               [B]

C. Labor cost per BILLABLE hour
   C = A / B                                      [C]

D. Overhead per billable hour
   Annual overhead (trucks, fuel, insurance,
   software, office staff, rent, marketing,
   licenses, tools, phones):                      [overhead]
   Company billable hours per year:               [company billable hours]
   D = overhead / company billable hours          [D]

E. Break-even rate
   E = C + D                                      [E]

F. Billable hourly rate with profit
   Target net margin as a decimal:                [m]
   F = E / (1 - m)                                [F]

Check F against: your recent win rate on quotes,
your callback rate, and your local wage data.
Hourly rate or flat-rate pricing?
Many plumbing companies quote flat prices per task instead of showing hours. The math underneath is the same: a flat price is estimated hours times your billable hourly rate, plus materials and your materials markup, plus an allowance for jobs that run long. The plumber hourly rate from the worksheet drives both.
| Approach | Best for | Trade-off |
|---|---|---|
| Hourly (time and materials) | Diagnostics, unclear scope, remodel rough-in | Customers may worry about the clock running |
| Flat rate per task | Repeatable repairs such as fixture or water heater swaps | You carry the risk when a job runs long |
| Bid or estimate | New construction and larger repipes | Needs careful takeoffs and change orders |
Pricing after-hours and emergency calls
Emergency work costs more to deliver. Technicians on call expect extra pay, night jobs disrupt the next day’s schedule, and fewer calls can be routed efficiently. Decide in advance whether you handle this with a separate after-hours rate, a fixed surcharge or a higher minimum charge, and build it from the same worksheet: higher labor cost per paid hour, lower billable ratio. Tell the customer the after-hours terms before the technician is dispatched, and print them on the invoice so there are no surprises.
Whichever approach you use, put the same rate into your estimating and invoicing tools so every quote is built on the same cost base. Our guides to plumbing estimating software, plumbing software and the free plumbing invoice template show where the rate gets used day to day.
Finding local plumber salary data
National medians hide large regional differences. BLS points readers to state and metro wage data from the OEWS program, which produces employment and wage estimates annually for over 800 occupations, with estimates for the nation, states, and metropolitan and nonmetropolitan areas. BLS also links CareerOneStop, which has a salary tool that searches wages by ZIP code.
Use local plumber salary data in two ways. First, to set technician wages that will actually attract and keep people in your area. Second, to sanity-check Step 1 of the worksheet: if your loaded labor cost is far below local wages, your plumber hourly rate may not hold once you hire.
Checklist before you publish your plumbing labor rate
- Loaded labor cost uses real payroll numbers, not the wage alone.
- Billable ratio comes from your time sheets, not a guess.
- Overhead includes vehicles, insurance, software and office pay.
- Profit is set as a margin and checked with the division method.
- After-hours and emergency work has its own rate or surcharge policy.
- Estimates, invoices and your software all use the same rate.
- You review the rate at least once a year, and whenever wages, fuel or insurance change.
If customers ask why your plumber hourly rate is higher than what the plumber earns, a short, honest explanation of the items above, without sharing your books, tends to work better than a discount.
How we compiled this guide
Wage figures come from four BLS Occupational Outlook Handbook pages (plumbers, pipefitters and steamfitters; electricians; HVAC mechanics and installers; general maintenance and repair workers) and the BLS May 2025 Occupational Employment and Wages news release. We checked every page on November 1, 2026. BLS updates these figures each year, so we plan to refresh this guide when new data is published. The plumber hourly rate method and worksheet are our own and use placeholders, because no official source publishes what plumbers charge. This is not tax or accounting advice.
Frequently asked questions
What is the average plumber hourly rate?
BLS reports a 2025 median of $63,800 per year, or $30.67 per hour, for plumbers, pipefitters and steamfitters. That is a median wage, the midpoint of what workers earn, not an average and not a customer price. Pay varies with experience, licensing, employer and location.
How much does a plumber charge per hour?
No official source publishes what plumbers charge customers, so any single number you see online is an estimate. A billed rate must cover wages, payroll costs, unbillable time, vehicles, overhead and profit, which is why it sits well above the wage. Use the worksheet in this guide to calculate your own.
Do plumbers earn more than electricians or HVAC technicians?
Nationally, the medians are close. Using BLS figures, plumbers earn $30.67 per hour, compared with $30.38 for electricians and $29.33 for HVAC technicians. General maintenance and repair workers earn less. Local pay can rank differently, so check state and metro wage data before drawing conclusions for your area.
Do the BLS figures include self-employed plumbers?
No. BLS says its Occupational Outlook Handbook pay data does not include self-employed workers, because the OEWS survey does not collect them. Owner-operators and sole proprietors are therefore not reflected in the plumber median. Their income depends on their own pricing, costs and the number of hours they can bill.
How do I calculate a billable hourly rate for my plumbing business?
Add payroll costs to the wage, divide by your billable ratio, add overhead per billable hour, then divide that break-even figure by one minus your target margin. Use your own payroll, time sheet and profit and loss data, and review the result at least once a year.
Do apprentice plumbers earn less?
Yes. BLS says apprentices earn less than fully trained plumbers, pipefitters and steamfitters, and that their pay rises as they learn to do more. Most learn through a 4- or 5-year apprenticeship that combines paid on-the-job training with technical instruction, and most states require plumbers to be licensed.